Builders: Base Cuts and Sales Incentive Usage Are at Record Highs
November 17, 2022
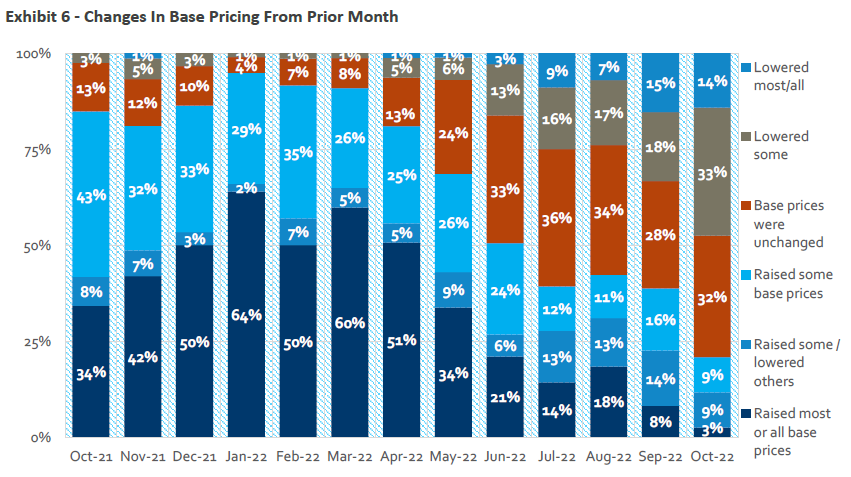
The number of builders who reported raising prices in our latest State of the Industry Report, compiled with BTIG, decreased in October to a survey record low, while the number of builders lowering prices increased to a survey record high.
Twelve percent of respondents raised “most/all” or “some” base prices in October from September, which is down 24%, while 47% cut some, most or all base prices compared to 33% in September. An additional 9% raised some base prices but lowered others, for a total of 56% who cut bases on at least some homes.
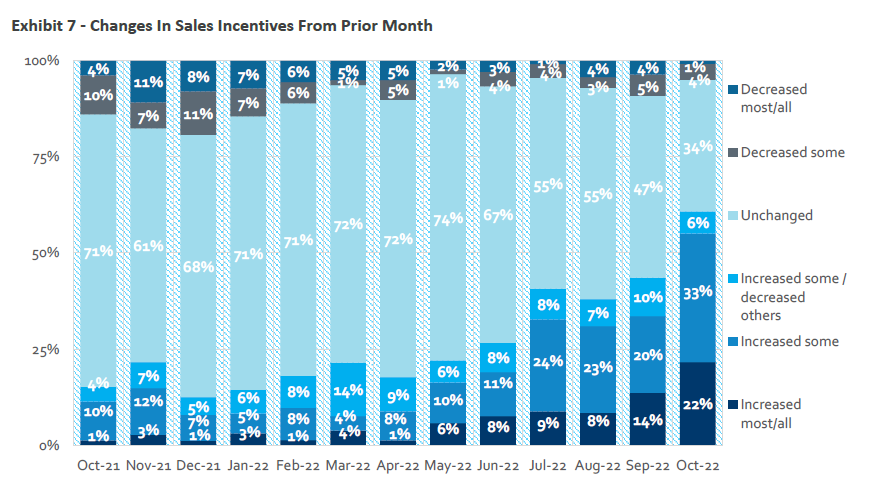
Meanwhile, incentive use increased from September to a survey-record high as 55% of respondents reported increasing "most/all" or "some" incentives compared to 34% for September. An additional 6% increased incentives on some units while decreasing them on others, equaling a total of 61% who raised incentives on at least some of their product offerings.
It’s likely that in the coming seasonally-slow months, and with weakened demand, that builders will continue to reduce prices and increase the use of incentives.
Conditions continue to be weak thanks to higher mortgage rates, fear of falling real estate values and weak economic confidence among consumers. The October data is in line with the latest builder confidence index from NAHB and Wells Fargo, which came in at 33 in November — down five points.
Highlights from the latest State of the Industry Report
Sales and traffic trends remain soft. Only 7% of respondents reported year-over-year increases in sales orders per community versus 7% for September and 42% in October 2021. 71% saw a year-over-year decrease in orders versus 63% for September and 23% for the same month last year. Only 11% reported an increase in year-over-year traffic at communities, while 70% saw a decline. This compares to 12% and 61%, respectively, for September.
Sales and traffic performance relative to internal expectations is also very weak. Sales and traffic relative to expectations continue to be soft and the better minus-worse ratio for both indicators remains negative. A survey record-low 7% of respondents saw sales as better than expected while a survey record-high 55% saw sales as worse than expected. For September, 10% of respondents saw sales better than expectations and 48% saw worse. Twelve percent of builders saw traffic as better than expected, while 45% of builders saw traffic as worse than expected (13% and 40%, respectively, for September).
HomeSphere/BTIG State of the Industry Report
HomeSphere partners with the global investment bank BTIG to create a monthly report to provide our builders and manufacturers with exclusive and timely insights about the market.
To compile the report, we survey HomeSphere’s 2,700+ regional and local home builders about sales, traffic, pricing, labor costs and other key industry metrics.
How to get the monthly report
If you are a builder and would like to participate and receive the monthly report for free, request an invitation below:

