Trends Sluggish for Private Builders, Seasonally Normal for Publics
November 16, 2023
In the latest HomeSphere/BTIG State of the Industry Report private builders suggest a weak operating environment is the cause for the sluggish sales they are experiencing.
As reported by private builders, higher interest rates and availability and cost of capital has weakened the demand for new homes. A much different story is told by public home builders whose operating costs and the ability to buy down mortgages are making conditions more favorable.
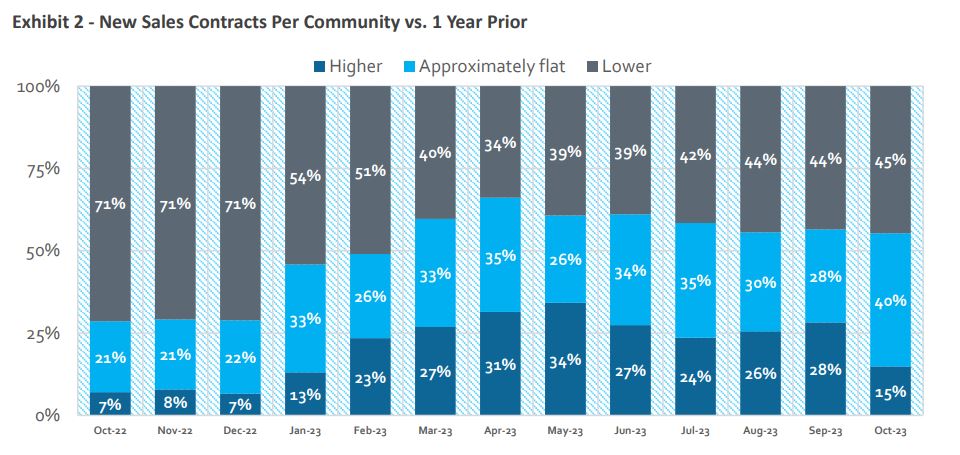
In the latest report, sales increased 15% compared to 28% in September. Forty-five percent of builders reported a decrease, compared to 44% the previous month. At the same time, private builders are seeing a decline in traffic, with 48% reporting a decrease and only 16% seeing an increase. In addition, traffic and sales expectations declined in October.
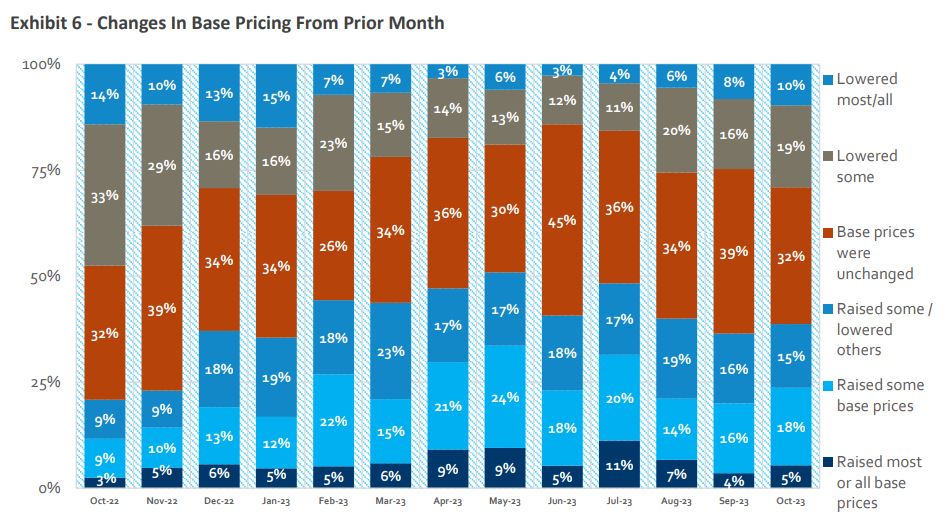
Slightly more builders reported raising prices, but offset the increase and unfavorable interest rates with more incentives as the market heads into the winter months. Builders overwhelmingly addressed this in anecdotal commentary, in addition to the continuing challenge of building costs.
In October, incentive use was mixed, but elevated. Private builders typically keep eye on the market and become more aggressive in pricing and incentives when heading into winter, which normally wanes in the spring.
The latest NAHB/Wells Fargo Housing Market Index (released Nov. 16, 2023) came in at 34, another drop as demand trends continue to decline.
Highlights from the latest State of the Industry Report
Sales and traffic trends worsen in October from September but remain better than 2022's miserable trends. 15% of respondents reported yr/yr increases in sales orders per community vs. 28% last month and 7% in October 2022. 45% saw a yr/yr decrease in orders vs. 44% last month and 71% for the same month last year. 16% reported an increase in yr/yr traffic at communities; 48% saw a decline vs. 27% and 39%, respectively, last month and 11% and 70%, respectively in October last year.
Sales performance relative to internal expectations improve in October, while traffic performance relative to internal expectations worsen. 27% of respondents saw sales as better than expected; 28% saw sales as worse than expected (negative spread of -1). Last month, 19% of respondents saw sales better than expectations and 30% saw worse (negative spread of -11). 19% of builders saw traffic as better than expected, while 36% of builders saw traffic as worse than expected (negative spread of -17). This compares to 24% and 31%, respectively, last month (negative spread of -7).
Builders pricing activity and the use of incentives remains mixed. 23% of builders reported raising either "most/all" or "some" base prices vs. 20% last month. 29% lowered "most/all" or "some" base prices vs. 24% last month. 31% reported increasing "most/all" or "some" incentives vs. 28% last month, while 6% reported decreasing "most/all" or "some" incentives vs. 5% last month.
HomeSphere/BTIG State of the Industry Report
HomeSphere partners with the global investment bank BTIG to create a monthly report to provide our builders and manufacturers with exclusive and timely insights about the market.
To compile the report, we survey HomeSphere’s 2,700+ regional and local home builders about sales, traffic, pricing, labor costs and other key industry metrics.
How to get the monthly report
If you are a builder and would like to participate and receive the monthly report for free, request an invitation below:

