July Builder Survey Results: Sales Pull Back as Traffic Holds Up
In this month's HomeSphere/BTIG State of the Industry Survey, July results were mixed, with sales taking a step back from June’s improvement while traffic held up relatively well. Pricing and incentive trends remained broadly stable, but builder commentary was slightly more cautious, reflecting renewed macroeconomic pressures heading into the summer.
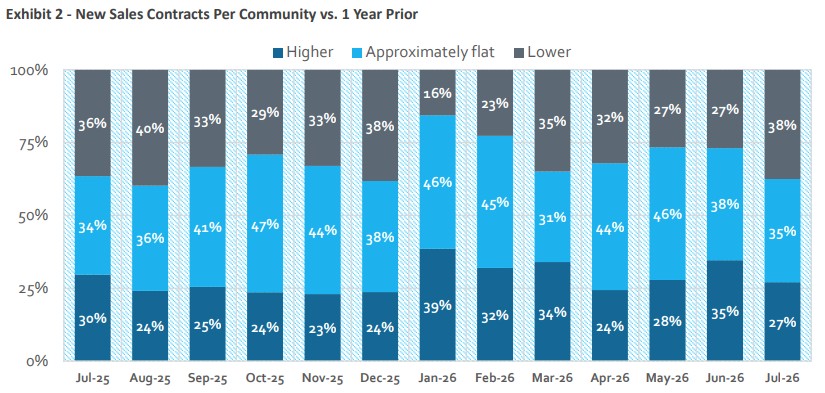
Sales weakened in July after two consecutive months of improvement. 27% of builders reported higher year-over-year sales, down from 35% in June.
Traffic was more resilient. 33% of builders reported higher year-over-year traffic in July, compared with 38% in June. While that was a modest decline, July’s reading remained well above April and May levels. At the same time, fewer builders reported lower traffic — 23% in July versus 27% in June.
The divergence between traffic and sales was a notable theme in July, with several builders reporting solid traffic but little corresponding increase in sales. Sales performance relative to expectations weakened in July, while traffic relative to expectations improved modestly. Together, the results suggest builders may have tempered their demand outlook heading into the summer, even as buyer traffic remained relatively steady.
The mixed results also point to a market where buyers are still showing interest, but converting that interest into sales remains challenging.
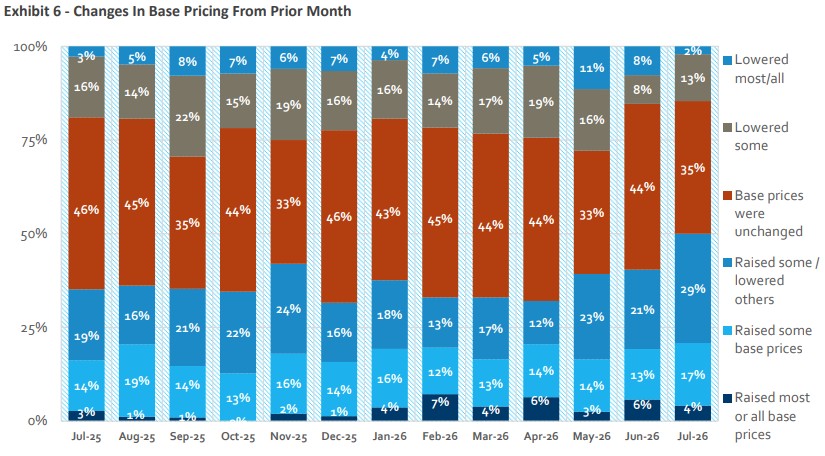
Pricing trends were relatively unchanged month over month. The share of builders reporting base-price reductions held steady, suggesting builders continued to resist broad price cuts.
Incentive activity showed some improvement, with fewer builders reporting increased incentives compared with June. This suggests builders were not broadly escalating incentives despite the softer sales environment.
Builder feedback in July skewed slightly more cautious than in June, with mixed reads across states. A recurring theme was traffic without a corresponding pickup in sales, highlighting continued uncertainty around buyer conversion. Some builders continue to see demand, but elevated borrowing costs and broader economic uncertainty appear to be keeping buyers on the sidelines longer.
July’s results came as the Iran conflict re-escalated, contributing to renewed pressure on financial and commodity markets. Mortgage rates moved above 6.8%, while WTI oil prices climbed above $90 per barrel at their highs, reversing some of the macroeconomic tailwinds that supported June’s improvement. Against that backdrop, some moderation in demand during July is not surprising. If mortgage rates and oil prices remain elevated, builders could continue to face softer sales and more cautious buyers in the months ahead.
The Bottom Line: July’s survey points to a housing market that remains uneven rather than broadly deteriorating. Traffic continues to hold up better than sales, pricing remains relatively disciplined, and builders are not broadly increasing incentives. However, the gap between buyer interest and actual sales, and the more cautious tone from builders suggests the summer market may be facing renewed headwinds.
The latest NAHB/Wells Fargo Housing Market Index (released August 17, 2026) inched up one point to 35.
Highlights from the latest State of the Industry Report
Sales and traffic. Sales pulled back in July after two months of improvement. 27% of builders reported higher year-over-year sales in July, down from 35% in June, while 38% reported lower y/y sales, a sharp reversal from 27% in June. Traffic remained steady, with 33% of builders reporting higher year-over-year traffic, down from 38% in June but well above April and May figures. Builders reporting lower traffic improved modestly to 23% vs. 27% in June.
Sales & traffic relative to expectations. Sales relative to expectations weakened in July. 23% of builders reported better-than-expected sales vs. 29% in June, while 29% reported worse-than-expected sales, a modest improvement from 31% in June. Traffic relative to expectations was a relative bright spot, 31% of builders reported better-than-expected traffic vs. 27% in June, and 29% reported worse than-expected traffic, improving from 33% in June.
Base Pricing. The percentage of builders raising some, most, or all base prices ticked up to 21% in July vs. 19% in June. The percentage lowering some, most, or all base prices remained flat, though the share reporting mixed pricing actions rose to 29% from 21% in June.
Incentives. 19% of builders reported increasing some, most, or all incentives in July, down from 29% in June. Mixed incentive activity across communities rose to 21% from 12% in June, and 56% left incentives unchanged, up slightly from 54% in June.
Builder commentary. Builder sentiment was more cautious in July, with a recurring theme across respondents of traffic not translating into sales, consistent with the survey data showing traffic holding up better than sales on a year-over-year basis.
HomeSphere/BTIG State of the Industry Report
HomeSphere partners with the global investment bank BTIG to create a monthly report to provide our builders and manufacturers with exclusive and timely insights about the market.
To compile the report, we survey HomeSphere’s 2,700+ regional and local home builders about sales, traffic, pricing, labor costs and other key industry metrics. See how HomeSphere helps local builders capture rebates on the products they install.
How to get the monthly report
If you are a builder and would like to participate and receive the monthly report for free, request an invitation below: